嗨,在这篇博客中,我们将讨论如何使用 h3 索引轻松进行栅格分析。
客观的
为了学习,我们将计算出由 esri 土地覆盖确定的聚居区有多少建筑物。让我们针对矢量和栅格的国家级数据进行目标。
我们先找到数据
下载栅格数据
我已经从 esri land cover 下载了定居点区域。
- https://livingatlas.arcgis.com/landcover/
让我们下载2023年,大小约362mb

下载尼泊尔 osm 建筑
来源:http://download.geofabrik.de/asia/nepal.html
288241523188
预处理数据
让我们在实际的 h3 单元计算之前对数据进行一些预处理
我们将在这一步中使用 gdal 命令行程序。在你的机器上安装 gdal
转换为云优化的 geotiff
如果您不知道 cog ,请在此处查看:https://www.cogeo.org/
- 检查gdal_translate是否可用
gdal_translate --version
它应该打印您正在使用的 gdal 版本
- 将光栅重新投影为 4326
您的栅格可能有不同的源 srs ,相应地更改它
gdalwarp esri-settlement-area-kathmandu-grid.tif esri-landcover-4326.tif -s_srs epsg:32645 -t_srs epsg:4326
- 现在让我们将 tif 转换为云优化的 geotif
gdal_translate -of cog esri-landcover-4326.tif esri-landcover-cog.tif
将重新投影的 tiff 转换为 geotiff 大约需要一分钟
将osm数据插入postgresql表
我们正在使用 osm2pgsql 将 osm 数据插入到我们的表中
osm2pgsql --create nepal-latest.osm.pbf -u postgres
osm2pgsql 总共花费了 274 秒(4m 34 秒)。
如果您有任何使用 ogr2ogr 的文件,也可以使用 geojson 文件
ogr2ogr -f postgresql pg:"dbname=postgres user=postgres password=postgres" buildings_polygons_geojson.geojson -nln buildings
ogro2gr 对驱动程序有广泛的支持,因此您可以非常灵活地选择输入内容。输出是 postgresql 表
计算h3指数
postgresql
安装
pip install pgxnclient cmake pgxn install h3
在您的数据库中创建扩展
create extension h3; create extension h3_postgis cascade;
现在让我们创建建筑物表
create table buildings ( id serial primary key, osm_id bigint, building varchar, geometry geometry(polygon, 4326) );
向表中插入数据
insert into buildings (osm_id, building, geometry) select osm_id, building, way from planet_osm_polygon pop where building is not null;
日志和计时:
updated rows 8048542 query insert into buildings (osm_id, building, geometry) select osm_id, building, way from planet_osm_polygon pop where building is not null start time mon aug 12 08:23:30 npt 2024 finish time mon aug 12 08:24:25 npt 2024
现在让我们使用 centroid 计算这些建筑物的 h3 指数。这里 8 是我正在研究的 h3 分辨率。在这里了解有关决议的更多信息
alter table buildings add column h3_index h3index generated always as (h3_lat_lng_to_cell(st_centroid(geometry), 8)) stored;
光栅操作
安装
pip install h3 h3ronpy rasterio asyncio asyncpg aiohttp
确保重新投影的齿轮处于静态/
mv esri-landcover-cog.tif ./static/
运行 repo 中提供的脚本以从栅格创建 h3 像元。我正在按模式方法重新采样:这取决于您拥有的数据类型。对于分类数据模式更适合。在这里了解有关重采样方法的更多信息
python cog2h3.py --cog esri-landcover-cog.tif --table esri_landcover --res 8 --sample_by mode
日志:
2024-08-12 08:55:27,163 - info - starting processing 2024-08-12 08:55:27,164 - info - cog file already exists: static/esri-landcover-cog.tif 2024-08-12 08:55:27,164 - info - processing raster file: static/esri-landcover-cog.tif 2024-08-12 08:55:41,664 - info - determined min fitting h3 resolution: 13 2024-08-12 08:55:41,664 - info - resampling original raster to : 1406.475763m 2024-08-12 08:55:41,829 - info - resampling done 2024-08-12 08:55:41,831 - info - new native h3 resolution: 8 2024-08-12 08:55:41,967 - info - converting h3 indices to hex strings 2024-08-12 08:55:42,252 - info - raster calculation done in 15 seconds 2024-08-12 08:55:42,252 - info - creating or replacing table esri_landcover in database 2024-08-12 08:55:46,104 - info - table esri_landcover created or updated successfully in 3.85 seconds. 2024-08-12 08:55:46,155 - info - processing completed
分析
让我们创建一个函数来获取多边形中的_h3_indexes
create or replace function get_h3_indexes(shape geometry, res integer) returns h3index[] as $$ declare h3_indexes h3index[]; begin select array( select h3_polygon_to_cells(shape, res) ) into h3_indexes; return h3_indexes; end; $$ language plpgsql immutable;
让我们获取我们感兴趣的区域中所有被确定为建筑面积的建筑物
with t1 as ( select * from esri_landcover el where h3_ix = any ( get_h3_indexes( st_geomfromgeojson('{ "coordinates": [ [ [83.72922006065477, 28.395029869336483], [83.72922006065477, 28.037312312532066], [84.2367635433626, 28.037312312532066], [84.2367635433626, 28.395029869336483], [83.72922006065477, 28.395029869336483] ] ], "type": "polygon" }'), 8 ) ) and cell_value = 7 ) select * from buildings bl join t1 on bl.h3_ix = t1.h3_ix;
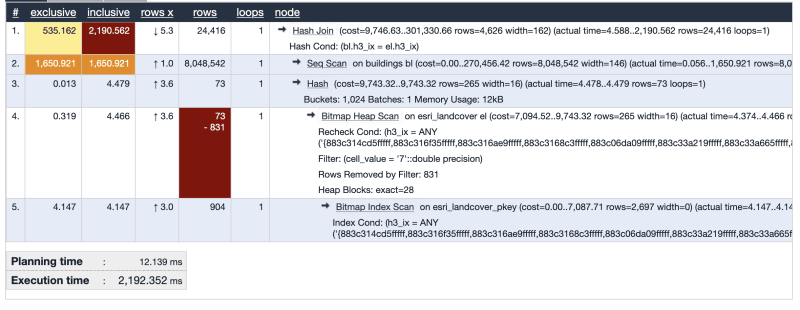
查询计划:

如果在建筑物的 h3_ix 列上添加索引,这可以进一步增强
create index on buildings(h3_ix);
拍摄计数时:我所在的地区有 24416 座建筑,其建筑等级属于 esri
确认
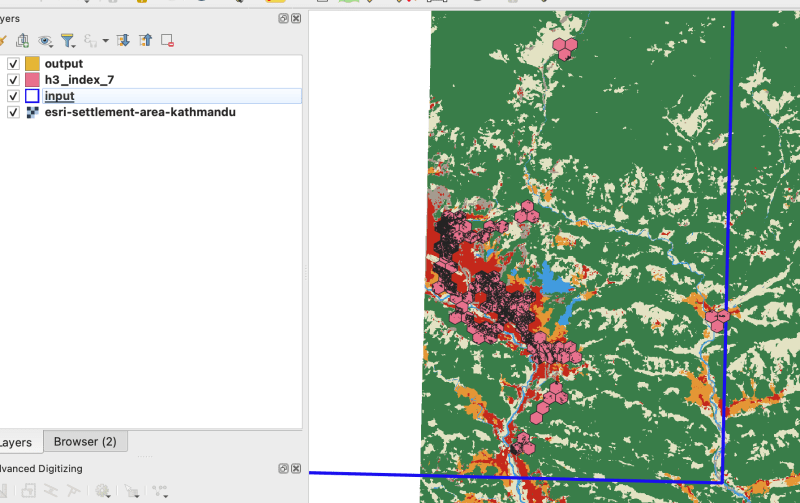
让我们验证输出是否为真:让我们以 geojson 形式获取建筑物
with t1 as ( select * from esri_landcover el where h3_ix = any ( get_h3_indexes( st_geomfromgeojson('{ "coordinates": [ [ [83.72922006065477, 28.395029869336483], [83.72922006065477, 28.037312312532066], [84.2367635433626, 28.037312312532066], [84.2367635433626, 28.395029869336483], [83.72922006065477, 28.395029869336483] ] ], "type": "polygon" }'), 8 ) ) and cell_value = 7 ) select jsonb_build_object( 'type', 'featurecollection', 'features', jsonb_agg(st_asgeojson(bl.*)::jsonb) ) from buildings bl join t1 on bl.h3_ix = t1.h3_ix;
让我们也获得h3细胞
with t1 as ( select *, h3_cell_to_boundary_geometry(h3_ix) from esri_landcover el where h3_ix = any ( get_h3_indexes( st_geomfromgeojson('{ "coordinates": [ [ [83.72922006065477, 28.395029869336483], [83.72922006065477, 28.037312312532066], [84.2367635433626, 28.037312312532066], [84.2367635433626, 28.395029869336483], [83.72922006065477, 28.395029869336483] ] ], "type": "polygon" }'), 8 ) ) and cell_value = 7 ) select jsonb_build_object( 'type', 'featurecollection', 'features', jsonb_agg(st_asgeojson(t1.*)::jsonb) ) from t1

增加 h3 分辨率后可以提高准确性,并且还取决于输入和重采样技术
清理
删除我们不需要的桌子
drop table planet_osm_line; drop table planet_osm_point; drop table planet_osm_polygon; drop table planet_osm_roads; drop table osm2pgsql_properties;
可选 – 矢量平铺
为了可视化图块,我们可以使用 pg_tileserv 快速构建矢量图块
- 下载pg_tileserv 从上面提供的链接下载或使用
- 导出凭证
export database_url=postgresql://postgres:postgres@localhost:5432/postgres
- 授予我们表选择权限
grant select on buildings to postgres; grant select on esri_landcover to postgres;
- 让我们在 h3 索引上创建几何图形以进行可视化(如果您从 st_asmvt 手动构建图块,则可以直接从查询中执行此操作)
alter table esri_landcover add column geometry geometry(polygon, 4326) generated always as (h3_cell_to_boundary_geometry(h3_ix)) stored;
- 在该 h3 几何图形上创建索引以有效地可视化它
create index idx_esri_landcover_geometry on esri_landcover using gist (geometry);
- 奔跑
./pg_tileserv

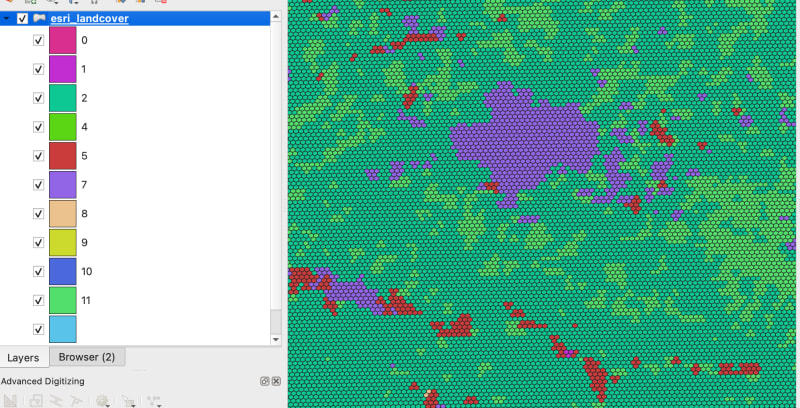
- 现在您可以根据图块值或任何您想要的方式可视化这些 mvt 图块,例如:maplibre!您还可以可视化处理结果或与其他数据集结合。 这是我根据 qgis 中的 cell_value 对 h3 索引进行的可视化

源代码库:https://hub.com/kshitijrajsharma/raster-analysis-using-h3
参考 :
- https://blog.rustprooflabs.com/2022/04/postgis-h3-intro
- https://jsonsingh.com/blog/uber-h3/
- https://h3ronpy.readthedocs.io/en/latest/
以上就是使用 Uber hndexes 和 PostgreSQL 进行栅格分析的详细内容,更多请关注php中文网其它相关文章!
 微信扫一扫打赏
 支付宝扫一扫打赏

